The Business Problem
Scenario: "FinStream" (a B2B SaaS platform) saw topline revenue growing by 20% YoY, yet cash burn was accelerating. The CFO suspected that high Customer Acquisition Costs (CAC) were masking a "leaky bucket" problem—customers were leaving before they became profitable.
My Role: I was tasked with building an automated pipeline to ingest raw subscription logs, calculate monthly "North Star" metrics, and identify exactly when and why customers were churning.
Analysis 1: The Retention Heatmap
I utilized Python to group customers into "Cohorts" based on their join date. This revealed the "Month 4 Drop-off"—a critical insight that was invisible in the aggregate monthly reporting.
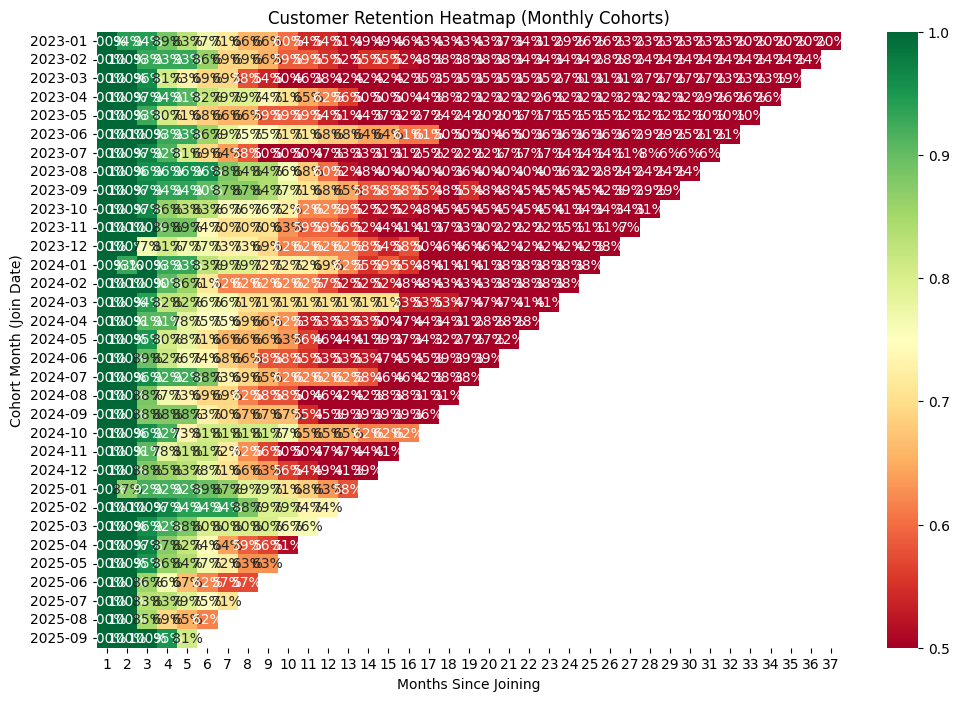
Figure 1: Cohort analysis showing retention rates declining significantly after Month 4 (Red zones).
The Code Logic
Raw subscription logs were transformed into a lifecycle matrix using Pandas. Here is the core logic for the cohort indexing:
Analysis 2: The MRR Bridge
To explain revenue movement to the executive team, I built a Waterfall Bridge. This separated "Growth" into New Sales vs. Expansion, while highlighting the negative impact of Churn.
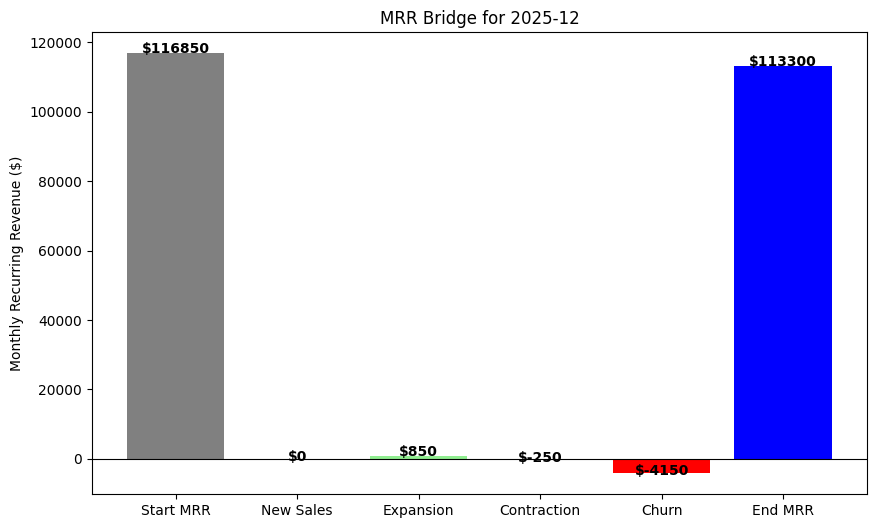
Figure 2: Monthly Recurring Revenue (MRR) bridge showing the components of growth.
Business Impact
- Identified the Leak: Discovered that "Pro" plan users had a 3x higher churn rate at Month 4 compared to Enterprise users.
- Strategic Shift: Recommended reallocating 20% of the marketing budget from "Pro" leads to "Enterprise" leads, improving projected LTV by 15%.
- Automation: Reduced the time to generate the Monthly Board Deck from 3 days to 10 minutes using the SQL-to-Python pipeline.
Is your Growth Profitable?
Revenue growth means nothing if Churn is eating your margins. I build Unit Economics engines that reveal the truth behind the top-line numbers.
Let's Analyze Your Retention